Thursday, April 7, 2011

A Back Test On a Larry Connors Strategy

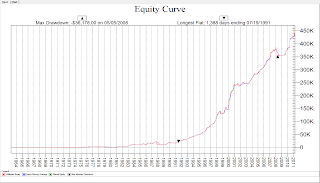
This is just a simple back test on a simple but effective strategy from Larry Connors.

This test is on the S&P 500 stocks.
The rules are buy at the next market open on a limit order if the 2 period rsi is below 2 and the stock is above the 200 day moving average.
All trades are taken in the test and no stops are used.
Exit when the stock closes above the 9 day moving average.
This test is for long only.
 No transaction costs are figured.
The strategy buys 100 shares per trade. However to make this worth it, you would need to trade a minimum of 200 shares. (The average profit per trade is only $27 on 100 shares.


A couple of things to point out.
The average profit per trade is low so it requires a decent position size.
The draw downs were very small and it has a nice 45 degree angle equity curve.
You probably can't take every trade on big pullbacks when there are many opportunities to pick.
No stops are used in this test but I will likely create another similar test with a stop and see how much of an effect it has.

The stop will have to be a rather wide stop as more of a catastrophic protection. Only protective puts protect from overnight exposure and those could be used in conjunction with the strategy.

I buy the S&P stocks when they hit 5 on the 2 period rsi, but I plan for a maximum of 4 buy ins as the stock drops. This above method figures only 1 buy in at a lower 2 period rsi level.

Monday, April 4, 2011

These are not good odds :)

Wow, this is interesting. 2 major forex brokers reported that 70 percent of all accounts lost money each of the last 4 quarters, according to the following LA Times article. Are you kidding???

I knew the odds were stacked against all but the best players but those are pretty abysmal stats for those that play forex. Random betting with a risk management system would have to do better than that I would think. But then again you have to beat the spread and the quirky things that happen in the forex market that don't happen in the futures market.

I've got some of my own stories of experiences in the futures and forex markets that a few people thinking about getting into the game might like to read but that's another day.

Anyway here's the link to the article.

http://www.latimes.com/business/la-fi-amateur-currency-trading-20110403,0,588787.story

2 Period RSI pullback stock buys

xlnx bought at 31.74 first 10 percent of position

dell bought at 14.17 first 10 percent of position

Both buys were through the folio fn trade window which worked out very well since both stocks moved down at the open.

Buying the next 20 percent of the position if either stock drops 1 percent or more +- a few ticks from the buy in price on the trade window.

Smarter Investing Relative Strength Ranks

Here are the current relative strength rankings for the Smarter Investing relative strength model as if Sunday April 4th. If you were to begin using this model you would buy the single highest ranked etf in each category. The ranking numbers are the column marked RS multiple MA 1. Most of these etfs are overbought and it might be wise to wait for a small pullback before getting in. The formula for the relative strength calculation is the 8 period weekly moving average / 15 period weekly moving average. It's a shorter time frame for calculations than I believe many people use. My portfolio is already long so I only hold one of the top ranks. The others have dropped down a bit. They will be sold when they either get stopped out, or drop down to the midpoint on the list.


You might also notice on these charts the Genesis Relative rankings in the middle column. This is another method for ranking the etfs which I use for another relative strength portfolio. I'm running that portfolio as well and seeing how they perform going forward. More on that in another future post. You can see significant differences in the rankings though. 

Sunday, April 3, 2011

Smarter Investing Relative Strength Portfolio

Here are the positions in my Smarter Investing Relative Strength Portfolio

Stops are the highest close since entry - (3* the average true range of a 10 bar period)
Relative Strength calculation uses a ratio of multiple moving averages. I'll give detail on this calculation in another post.

International Allocation -EWI
 stop set at 17.89
Current rank of EWI on the international allocation list is 2 out of  17 etfs. If the rank drops below 8 on the weekend evaluation it will be sold and replaced by the current #1 ranked international etf.

Asset collocation - IYR
stop set at 106.42
Current rank of IYR on the asset allocation portion of the portfolio is #3

Sector Allocation- IYE
stop set at 43.74
Current rank of IYE in the sector etf allocation is #1.

Smarter Investing in Any Economy The Definitive Guide to Relative Strength Investing Review


One of the etf investing strategies I am currently using is Relative Strength. Basically relative strength investing invests in the strongest performing etfs or stocks. The idea is that those sectors that have been performing the strongest in the past will continue to perform strong in the current year.

The book Smarter Investing in Any Economy The Definitive Guide to Relative Strength Investing,  by Michael Carr,is a comprehensive study of this method with thorough back testing and results to support it. If you are interested in this subject, this book is a must read. 

The book begins by discussing why relative strength investing works. People tend to pile into markets that have performed well creating trends. Carr provides many references to studies on trend following and the results which support relative strength investing.

Carr then proceeds to explore and test 9 methods in detail for calculating relative strength. Carr gives the formulas and back testing results for each method. This research alone would be worth the price of the book since back testing relative strength strategies is very difficult to do. All 9 methods for calculating relative strength out performed the S&P 500 which supports the robustness of this strategy. 

Carr then selects the strategy he felt had the best risk reward. He works on optimizing this strategy, but is very careful and aware of data mining and over optimization. You can be confident his optimization work is reliable as his results provide a wide range of profitability and selecting a range of inputs will still beat the S&P 500. 

One of the qualities that sets this book apart from most is the risk analysis, and the extra steps Carr takes to reduce risk in the relative strength method. The problem with relative strength investing is that, though it out performs when the market is going well, it can decline much steeper than the overall market when it begins to fail. You can give back all of your precious gains very quickly if you do not have risk management in your system. The method will rotate you out of the under performing sectors but without risk management you can suffer significant draw downs in a relative strength strategy. Carr advocates the uses of trailing stops which do reduce profits, but they reduce draw downs. Another area of risk reduction is diversity by using etfs, and a balance of asset classes. He provides 3 sets of etf groups and runs the strategy on these 3 etf groups which helps reduce the overall risk. He also uses an equity curve. The overall result is a significant reduction in draw down with a fairly minimal impact on profits. 

This book covers all of the bases on relative strength investing and is simply a must read on this strategy. I haven't come across many books that were so easy to read yet  packed with so much information.